Updated August 21, 2024 Authored by Chris Cloney

Turbulent Flame Structures, Image Credit: Luc Viatour
Most industrial explosions occur as turbulent flames propagating through processing equipment or facilities. In the case of gas explosion, the turbulence is due to the size of the flames and interaction with the surrounding equipment. For dust explosion additional turbulence is typically initiated by the process which dispersed the dust into the air in the first place (e.g., primary explosion or process upset condition).
Turbulent flames and flame propagation have similar considerations as laminar flames for heat transfer, mass transfer and reaction chemistry, with additional considerations from the enhanced mixing effects of turbulence. Due to enhanced transport properties, instability formation, and a larger flame surface, a turbulent flame can have a much faster propagation velocity than laminar flames. The propagation velocity is also much harder to define and requires understanding of the underlying flame structure.
Much work has gone into developing so-called Combustion Regime Diagrams or Phase Diagrams which map the turbulent flame structure based on a given set of variables. This post briefly reviews two of the first versions of these diagrams available in the literature: the Borghi Diagram for premixed turbulent flames, and the phase diagram developed by Peters for non-premixed turbulent flames. Note that hundreds of pages are devoted to this topic in combustion textbooks and that the description given here only provides a simplified overview. The interested reader is encouraged to review the original work by Peters published as Chapter 6 in the textbook by Oran and Borris “Numerical Simulation of Reactive Flow.” Much of the mathematical background and further development of phase diagrams is given in Chapter 5 and 6 of the textbook by (Applications of Turbulent and Multiphase Combustion, Kuo, 2012).
Turbulence Background
The degree of turbulence in a fluid system is typically characterized by the Reynolds number (\(\text{Re}\)) of the flow. The Reynolds number is defined as the ratio of inertial forces to viscous forces on individual fluid elements. The inertial forces tend to destabilize the flow and are characterized by the velocity and length scales (representative of shear stresses). The viscous forces tend to stabilize the flow and are characterized by the viscosity of the fluid.
\(\text{Re} = \frac{\text{Inertial Forces}}{\text{Viscous Forces}} = \frac{uL}{\nu}\)
\(u: \text{[Characteristic Velocity (m/s)]}\)
\(L: \text{[Characteristic Length (m)]}\)
\(\nu: \text{[Kinematic Viscosity (m}^{2}\text{/s)]}\)
When the inertial forces exceed the viscous forces by a large amount (\(\text{Re} \gg 1\)), erratic, irregular, and randomized flow patterns emerge. These structures can be seen when comparing the turbulent flame structure shown in the header photo of this post, to the laminar flames shown in a previous article. The onset of turbulence occurs at different Reynolds numbers depending on the system geometry, but is typically in the range of 100-10,000.
Premixed Turbulent Flames
According to Wikipedia, regarding turbulent premixed flames, fuel and oxidizer are being mixed by turbulence during a sufficiently long time before combustion is initiated. The deposition of energy from the spark generates a flame kernel that grows at first by laminar, then by turbulent premixed flame propagation. Under premixed conditions the flame structure depends on the interaction between the rotational turbulent flow (also called vortices or eddies) and the flame front. One of the most important unresolved problems in premixed turbulent combustion is that of the turbulent burning velocity. The starting point for development in this area is based on the Borghi phase diagram. Chapter 5.2 in Kuo (Applications of Turbulent and Multiphase Combustion, Kuo, 2012) outlines the construction of the Borghi diagram and many of studies building on this work.
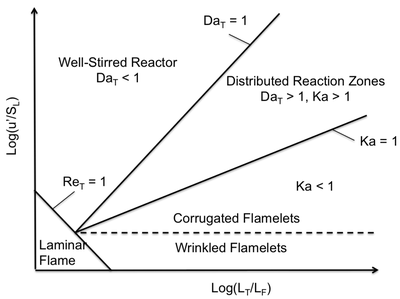
A schematic of the original Borghi diagram is given in the following figure. The flame composition is broken into five regions based on the ratio of the size of the turbulent eddies to the thickness of the laminar flame on the x-axis \((L_{\text{T}} \text{(m)}/L_{\text{F}} \text{(m)})\), and the ratio of the turbulent velocity fluctuations to the laminar flame velocity on the y-axis \((u^{\prime} \text{(m/s)}/S_{\text{L}} \text{(m/s)})\). The five regions are then sub-divided by three dimensionless numbers: the turbulent Reynolds number \((\text{Re}_{\text{T}})\), the turbulent Damkohler number \((\text{Da}_{\text{T}})\), and the Karlovitz number \((\text{Ka})\).

\(\text{Re}_{\text{T}} = \frac{\text{Representative Turbulent Viscosity}}{\text{Representative Laminar Viscosity}} = \frac{u^{\prime}L_{\text{T}}}{S_{\text{L}}L_{\text{L}}}\)
\(\text{Da}_{\text{T}} = \frac{\text{Turbulent Eddy Time}}{\text{Laminar Flame Passage Time}} = \frac{t_{\text{T}}}{t_{\text{L}}} = \frac{L_{\text{T}}/u^{\prime}}{L_{\text{F}}/S_{\text{L}}}\)
\(\text{Ka} = \frac{\text{Laminar Flame Passage Time}}{\text{Time for Flame Stretching}} = \frac{t_{\text{L}}}{t_{\text{K}}} = \frac{L_{\text{F}}/S_{\text{L}}}{t_{\text{K}}}\)
\(\frac{L_{\text{F}}}{S_{\text{L}}}: \text{[Laminar Flame Passage Time, }t_{\text{L}}\text{ (s)]}\)
\(\frac{L_{\text{T}}}{u^{\prime}}: \text{[Turnover time of largest eddies }t_{\text{T}}\text{ (s)]}\)
\(t_{\text{K}}: \text{[Turnover time of the smallest Eddies, (s)]}\)
In the case shown in the diagram, the turbulent Reynolds number is defined so that the flame is laminar when \(\text{Re}_{\text{T}} < 1\). The other four regions apply to turbulent flames. When the Damkohler number is greater than one, all eddies including the largest ones rotate many times during the passage of the flame. This breaks up the flame structure causing it to thicken. This leads to more vortices interacting with the flame and rapidly leads to entire vessel combustion as a Well-Stirred Reactor.
In the Distributed Reaction Zone the passage of the flame is fast relative to the largest eddies. However, the smallest eddies defined by the Kolmogorov Scale still enter the flame producing large strain rates and leading to local quenching and a distributed flame structure.
The conditions where all turbulent timescales are slower than the laminar flame passage is represented by the area where \(\text{Ka} < 1\). Under these conditions turbulent flames can be modeled as a series of thin Laminar Flamelets, which is useful for computer simulation. The flamelet region can be sub-divided into two areas based on the ratio \(u^{\prime}/S_{\text{L}}\). If the ratio is small, than the low turbulence level has only a wrinkling effect on the flame front. If the ratio is large, the turbulent eddies can act to “push the flamelets around” “Numerical Simulation of Reactive Flow“, although they can not enter the flame structure. This acts to cause large scale fluctuation in the flame front and a corrugated structure.
Non-Premixed Turbulent Flames
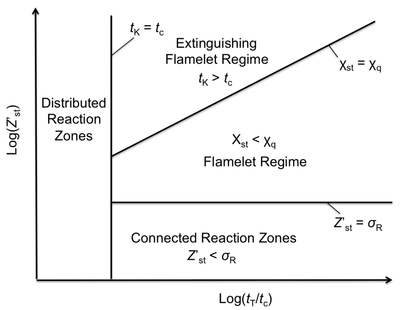
Under non-premixed conditions the overall mixing of the fuel and oxidizer also interacts with the turbulent combustion process. In the regime diagram developed by Peters [bibcite key=Oran1991] the flame structure is characterized by the mean fluctuation of the mixture around stochiometric conditions \((Z^{\prime}_{\text{st}})\), and the ratio of the turbulent eddy timescale to the chemistry time scale \((t_{\text{T}}/t_{\text{c}})\). Here the chemical timescale is similar to the laminar flame passage time for premixed combustion, and the mean fluctuation is given as a function of mixture fraction instead of in physical space. Chapter 6 in Kuo (Applications of Turbulent and Multiphase Combustion, Kuo, 2012) and Chapter 6 Section II-B in Oran and Borris “Numerical Simulation of Reactive Flow” give good explanations of the need to use mixture fraction space instead of physical space for scaling non-premixed turbulent flames.
The regime diagram presented by Peters is summarized in the figure below. The diagram is subdivided into four areas based on the Kolmogorov timescale (turning time for the smallest eddies in the flow), the scalar dissipation rate, and the mean mixture fluctuation compared to the reaction zone thickness. If the chemical timescale is larger than the Kolmogorov scale, all turbulent eddies can enter the flame structure. When this occurs in a non-premixed field, Distributed Reaction Zones occur.

\(\chi_{\text{St}}: \text{[Dissipation Rate At Stoichiometric Concentration, (1/s)]}\)
\(\chi_{\text{q}}: \text{[Dissipation Rate At Quenching Limit, (1/s)]}\)
\(\sigma_{\text{R}}: \text{[Reaction Zone Thickness in Mixture Fraction Space, (-)]}\)
When the chemical timescale is smaller than the turbulence timescales, the flame structure depends on the mean mixture fraction fluctuations. If these fluctuations are smaller than the reaction zone thickness, the flame will remain continuous as Connected Reaction Zones. When the mixture fluctuations are larger than the flame thickness, a Flamelet Regime occurs where again thin flamelets dominate the flow field. Lastly, if the mixture fluctuations are large enough, high flame strain rates will cause the dissipation rate to exceed the quenching limit. Here the individual flamelets may start to extinguish due to the high strain rates in the flow.
Understanding turbulent flame structures, premixed flames, the burning velocity of turbulence intensity, flame propagation and turbulent flame propagation, turbulent premixed flames, flame stability, flame thickness, and turbulent combustion, are important processes for manufacturing facilities. These processes will assist in identifying and creating a combustible dust hazard detailed analysis, combustible dust sources and formation, installing and maintaining production equipment, and installing and maintaining dust collection equipment, in manufacturing facilities. Flame propagation may be minimized, with the proper Fire and Explosion equipment installed.
