In this episode of the podcast we discuss the findings from the 2018 mid-year combustible dust incident report released on DustSafetyScience.com as part of the Combustible Dust Incident Database. The incident report was released earlier in the year and includes an analysis of materials, industries, equipment, and causes of 115 dust fires and explosions around the world. To see a summary of the main findings read below or see this recent Chemical Engineering magazine article: Combustible Dust Fires and Explosions: Recent data and lessons learned
Summary of Combustible Dust Incidents
The mid-year incident report covered 26 combustible dust explosions, 89 fires, 40 injuries and 9 fatalities in industries handling, transporting, or manufacturing powder and dusty materials. A summary of the incidents captured is given in the image below.
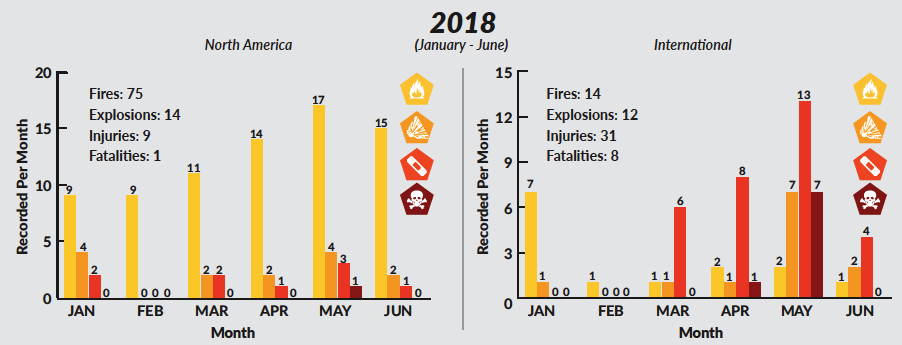
From the 2018 global data, 89% of the fatalities occurred due to explosions. From the injuries, 70% occurred from explosions while 30% were from fires. Some of the more severe incidents include:
Seven Killed in Grain Silo Explosion (Port Aqaba, Jordan)
One Killed in Grain Elevator Explosion (South Sioux City, NE)
One Killed and One Dead in Fluid Bed Dryer Fire (Madhya Pradesh, India)
Ten Injured in Metal Dust Explosion (Changhua, Taiwan)
In North America, the trend for capital cost was reversed from personal loss. Out of the 11 incidents with a reported loss of $1 Million and above, 8 were from fires and 3 were from explosions. Three incidents were recorded with losses above 15 million:
Cotton Seed Elevator Fire in Altus, Oklahoma ($20 Million)
Coal Silo Explosion in San Juan, New Mexico ($15-20 Million)
Metallurgic Dust Fire in Muskegon, Michigan ($15 Million)
Comparison Over Time
Although international data is limited, the Combustible Dust Hazard Study published by the US Chemical Safety Board gives information on explosions in the United States. From this report 5- and 25-year trends can be calculated as of 2005:
1980-2005: 11 Explosions, 28 Injuries and 5 Fatalities Per Year
2001-2005: 19 Explosions, 43 Injuries and 9 Fatalities Per Year
The incident database effort gives the following averages since 2016:
2016-2018: 28 Explosions, 24 Injuries and 4 Fatalities Per Year
This comparison suggests that the number of explosions per year is increasing over time. It also tentatively suggests that the explosions may be less severe although we have yet to see a year with zero fatalities in the United States. Note that these numbers have been updated from the original incident report to reflect only injuries and fatalities from dust explosions and only those in United States, excluding the rest of North America.
Materials Involved
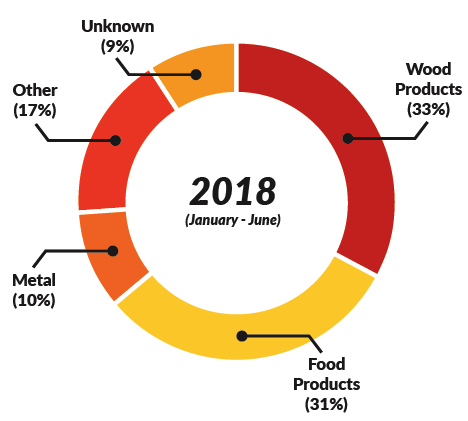
As shown in the historic data, wood and food products make up to 45% or more of the materials involved in combustible dust fires and explosions. Combustible products of wood processing include sawdust, chips, shavings, fibers and pellets. Food products included grain, flour, barley, pecan, cocoa, spices, and cereals in 2018.
Although wood and food products have a similar proportion of the overall incidents, the global 2018 data suggests that food products have a disproportionately higher percentage of explosions and more severe incidents:
Wood Products: 33 Fires, 5 Explosions, 10 Injuries, 0 Fatalities
Food Products: 24 Fires, 12 Explosions, 14 Injuries, 8 Fatalities
Other materials besides wood, food, and metal made up an average of 25% of the incidents considering all of the data. In 2018 these materials included paper, coal, carbon, sulfur, textile, and toner.
Industries Involved
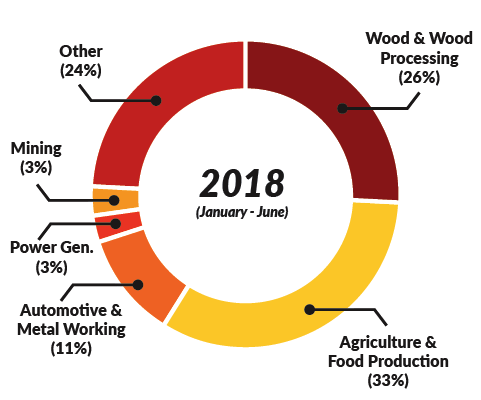
Again, wood processing, agricultural activities, and food production make up a large proportion of the overall fire and explosion incidents. Other industries not broken out in the data include: Pulp & Paper, Education, Coatings, Oil and Gas, Textiles, Recycling, and Other Manufacturing.
According to the 2018 incident data, Wood and Wood Product industries tended to have larger capital cost from combustible dust incidents. Out of the 11 incidents which reported losses of $1 million or more, six occurred in wood working, biomass storage, and pellet manufacturing industries. Five of these were fires and one was an explosion. Combined, these incidents resulted in $24 million in reported losses although the unreported losses are likely much higher.
The remaining five ‘High-Loss’ incidents included an explosion in a metal die-casting facility, two coal dust explosions at power generation and mining operations, respectively, and a fire at a cottonseed facility.
Equipment & Causes Involved
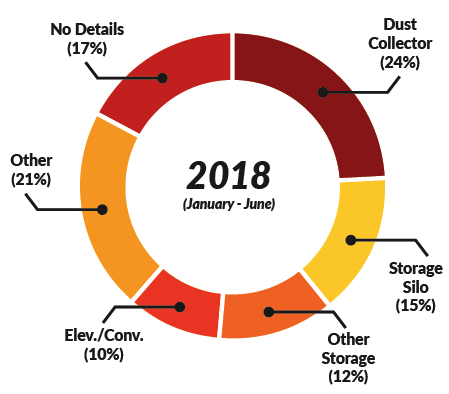
Dust collection equipment is the leading cause of combustible dust incidents with an average just over 20% since 2016. However, this value is less than the historical data which suggests an incident rate of up to 40%.
Dust collectors also make up a smaller proportion of the recorded dust explosions than the historical data with storage silos, elevators, and conveyors involved in more. The breakdown between fires and explosions in 2018 for different equipment is:
Dust Collectors: 25 Fires 3 Explosions
Storage Silos: 8 Fires 9 Explosions
Other Storage: 12 Fires 2 Explosions
Elevators/Conveyors: 7 Fires 5 Explosions
Other: 21 Fires 3 Explosions
No Details: 16 Fires 4 Explosions
There is very little data available outlining the initiating causes of fire and explosion incidents. Out of the seven incidents in North American wood handling industries with more than $1 million in losses or that caused injury in 2018, two mentioned sparking from equipment and one mentioned an air compressor as contributing factors.
Perhaps more telling is that each of these ‘high-loss’ incidents mentioned accumulation of combustible material such as sawdust, wood chips, lumber, and insulation as contributing to rapid spread of the building fire and firefighter difficulties in responding to the incident. Proper housekeeping may not stop the incident from occurring, but in all cases, it can reduce the total loss.
Preliminary Conclusions
At the end of the podcast episode we summarize several of the main conclusions from the mid-year combustible dust incident report. Some of these include:
- The overall number of explosions appears to be increasing when compared to historical data from the US Chemical Safety Board between 1980 and 2005.
- Wood products and food products are the most commonly reported materials in dust fire and explosion incidents.
- Wood processing industries had more ‘high-loss’ incidents in terms of facility destruction with 6/11 of the incidents with damages above $1 million.
- Food processing industries had more ‘high-loss’ incidents in terms of injuries and fatalities.
- Wood processing and food processing have a similar number of total incidents, but wood processing had a larger number of fires while food processing had a larger number of explosions.
- Dust collectors appeared to have a higher proportion of dust fires while storage silos and elevators had a higher proportion of explosions.
As the incident database grows and more details can be determined on the different incidents involved, these preliminary conclusions can be tested and further refined.
Acknowledgements
I would like to thank the dust safety member companies and report sponsors who make this research possible and provide innovative safety products and solutions to the combustible dust community:

Resources Mentioned
The resources mentioned in this episode are listed below.
Combustible Dust Incident Reports:
2018 Combustible Dust Incident Report (Mid-Year)
2017 Combustible Dust Incident Report
2016 Combustible Dust Incident Report (North America)
Chemical Engineering Magazine Article:
Combustible Dust Fires and Explosions: Recent data and lessons learned
Bulk Inside Article:
DustSafetyScience.com releases 2018 mid-year combustible dust incident report
Canadian Biomass Article:
Building a combustible dust incident database – Sharing and learning from combustible dust safety incidents
Powder & Bulk Solids Webinar:
Dust Explosion Expert to Present Free Webinar on Aug. 9
US Chemical Safety Board Report:
Investigation Report – Combustible Dust Hazard Study
Severe Incidents Reported in First Half of 2018:
Seven Killed in Grain Silo Explosion (Port Aqaba, Jordan)
One Killed in Grain Elevator Explosion (South Sioux City, NE)
One Killed and One Dead in Fluid Bed Dryer Fire (Madhya Pradesh, India)
Ten Injured in Metal Dust Explosion (Changhua, Taiwan)
Cotton Seed Elevator Fire in Altus, Oklahoma ($20 Million)
Coal Silo Explosion in San Juan, New Mexico ($15-20 Million)
Metallurgic Dust Fire in Muskegon, Michigan ($15 Million)
Thanks for Listening!
To share your thoughts:
- Leave a note in the comment section below
- Ask a question to be answered on the show
- Share this episode on LinkedIn, Twitter or Facebook
To help out the show:
- Subscribe to the podcast on iTunes
- Leave a review and rate our show in iTunes to help the podcast reach more people
Download the Episode
DSS 005: 2018 Mid-Year Combustible Dust Incident Report Review